Copper
China Holds 56% of the Capacity at the World's 21 Largest Copper Refineries
TWO OF THE 21 PLANTS WERE IDLE WHEN 2026 BEGAN. ONE IS DUE TO RESTART THIS MONTH
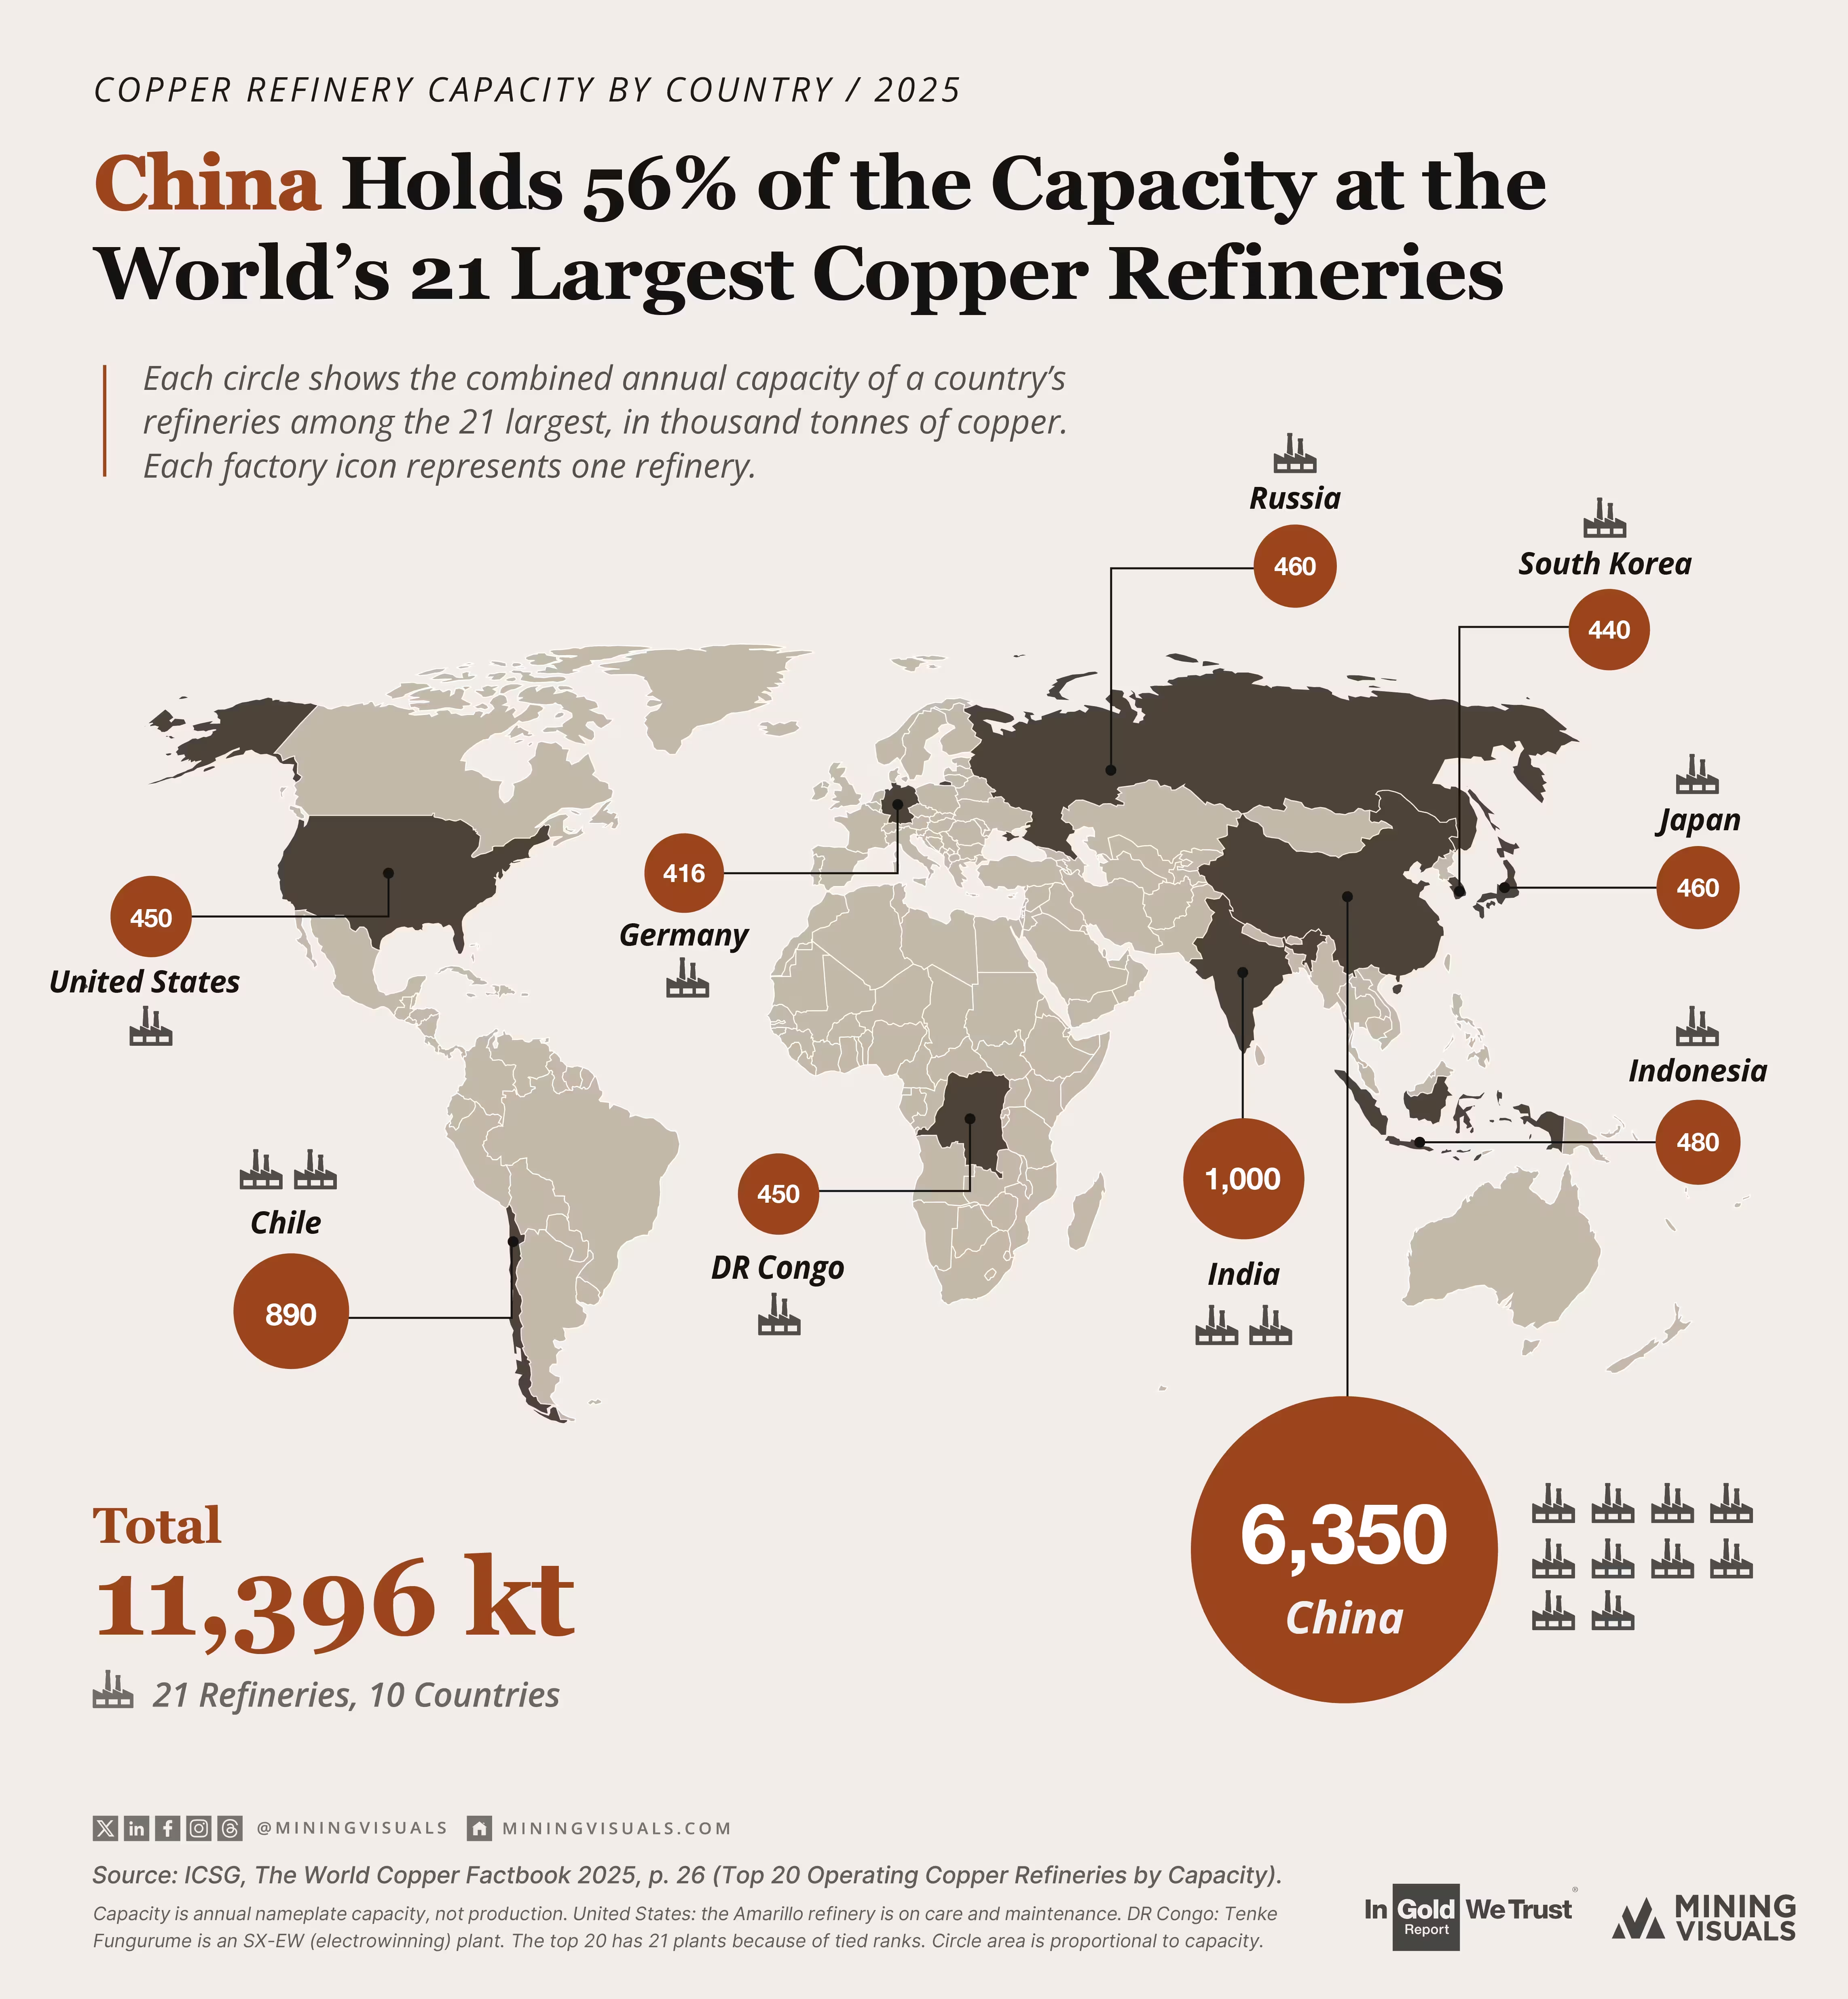

The 21 refineries on the map above can process 11.4 million tonnes of copper a year, equal to about a third of the world's refining capacity, according to the International Copper Study Group. Capacity is what a plant is built to handle, though, not what it produces. Two of the 21 were idle when 2026 began. One of them is Indonesia's only plant on the map, the Manyar refinery in East Java, operated by PT Freeport Indonesia. It had been shut since the fourth quarter of 2025 after a mudflow at the Grasberg mine cut off its concentrate supply, and it is due to restart this month at below 30% of capacity.
The second idle plant is ASARCO's Amarillo refinery in Texas, which ICSG marks as on care and maintenance. In January, parent Grupo Mexico said it would reopen Amarillo together with the Hayden smelter in Arizona, at an expected cost of $230 million. Manyar's pace depends on Grasberg, which we covered in June. Freeport Indonesia expects the mine's underground operations to reach only about 65% of capacity by the end of 2026, according to the same Indonesia Miner report.
The gap between capacity and output is not limited to these two plants. Across the world, refineries produced 27.5 million tonnes of copper in 2024, about 84% of what they could have, according to the ICSG.
China, which holds 56% of the capacity on the map, kept producing. Its refined output grew 7.4% in January to April, although its leading smelters had pledged a 10% cut for the year, and March set a record of 1.33 million tonnes, the highest in data going back to 1990. Sulphuric acid, a by-product of smelting, helps. Yang Changhua of Beijing Antaike said Chinese smelters can earn more than 5,000 yuan ($733) from acid per tonne of copper.
China's share comes from plant size as well as numbers. Its ten refineries among the 21 largest averaged 635,000 tonnes of capacity in 2025, against about 459,000 for the eleven elsewhere, according to the ICSG. That gives China 48% of the plants but 56% of their capacity, above its 45% share of world refined output in 2024. Copper fits the pattern covered in our August look at energy transition minerals.
.avif)
Of the three routes shown above, the 21 largest plants almost all follow the smelter route. SX-EW made 17.4% of the world's refined copper in 2024, according to the ICSG. Yet only one of the 21 largest plants uses it: Tenke Fungurume in Congo, run by CMOC, with about 4% of the group's capacity.
Most SX-EW copper comes from smaller plants, and Congo is the main example. The country produced 2.6 million tonnes of refined copper in 2024, all of it through SX-EW according to the ICSG, which is more than half of the world's SX-EW output. Tenke's capacity equals about 17% of that.
The reason is geology. Ores on the African Copperbelt, which runs through southern Congo, hold 1.5% to 5% acid-soluble copper, mostly in oxide minerals such as malachite, and are richer than those in other regions, according to a 2023 review in the Journal of the Southern African Institute of Mining and Metallurgy. SX-EW is the standard process for oxide ore. The same review counted nearly 50 SX-EW sites in Congo as of 2022, of which 20 produced more than 40,000 tonnes a year.
Processing fees for copper concentrate have fallen to zero. Antofagasta and a Chinese smelter agreed 2026 treatment and refining charges of zero, down from $21.25 a tonne for 2025. Reuters reported in June that spot charges had been negative for months, leaving smelters to depend on selling sulphuric acid, the by-product described above.
For Amarillo, the open question is in Washington. As of September 10, the White House had not decided whether to impose the proposed 15% duty on refined copper from January 2027, rising to 30% in 2028. Reuters reported that such tariffs could improve the economics of US smelting and refining projects.
MiningVisuals Disclaimer: This article is for informational purposes only and does not constitute financial or investment advice. Always conduct your own research.

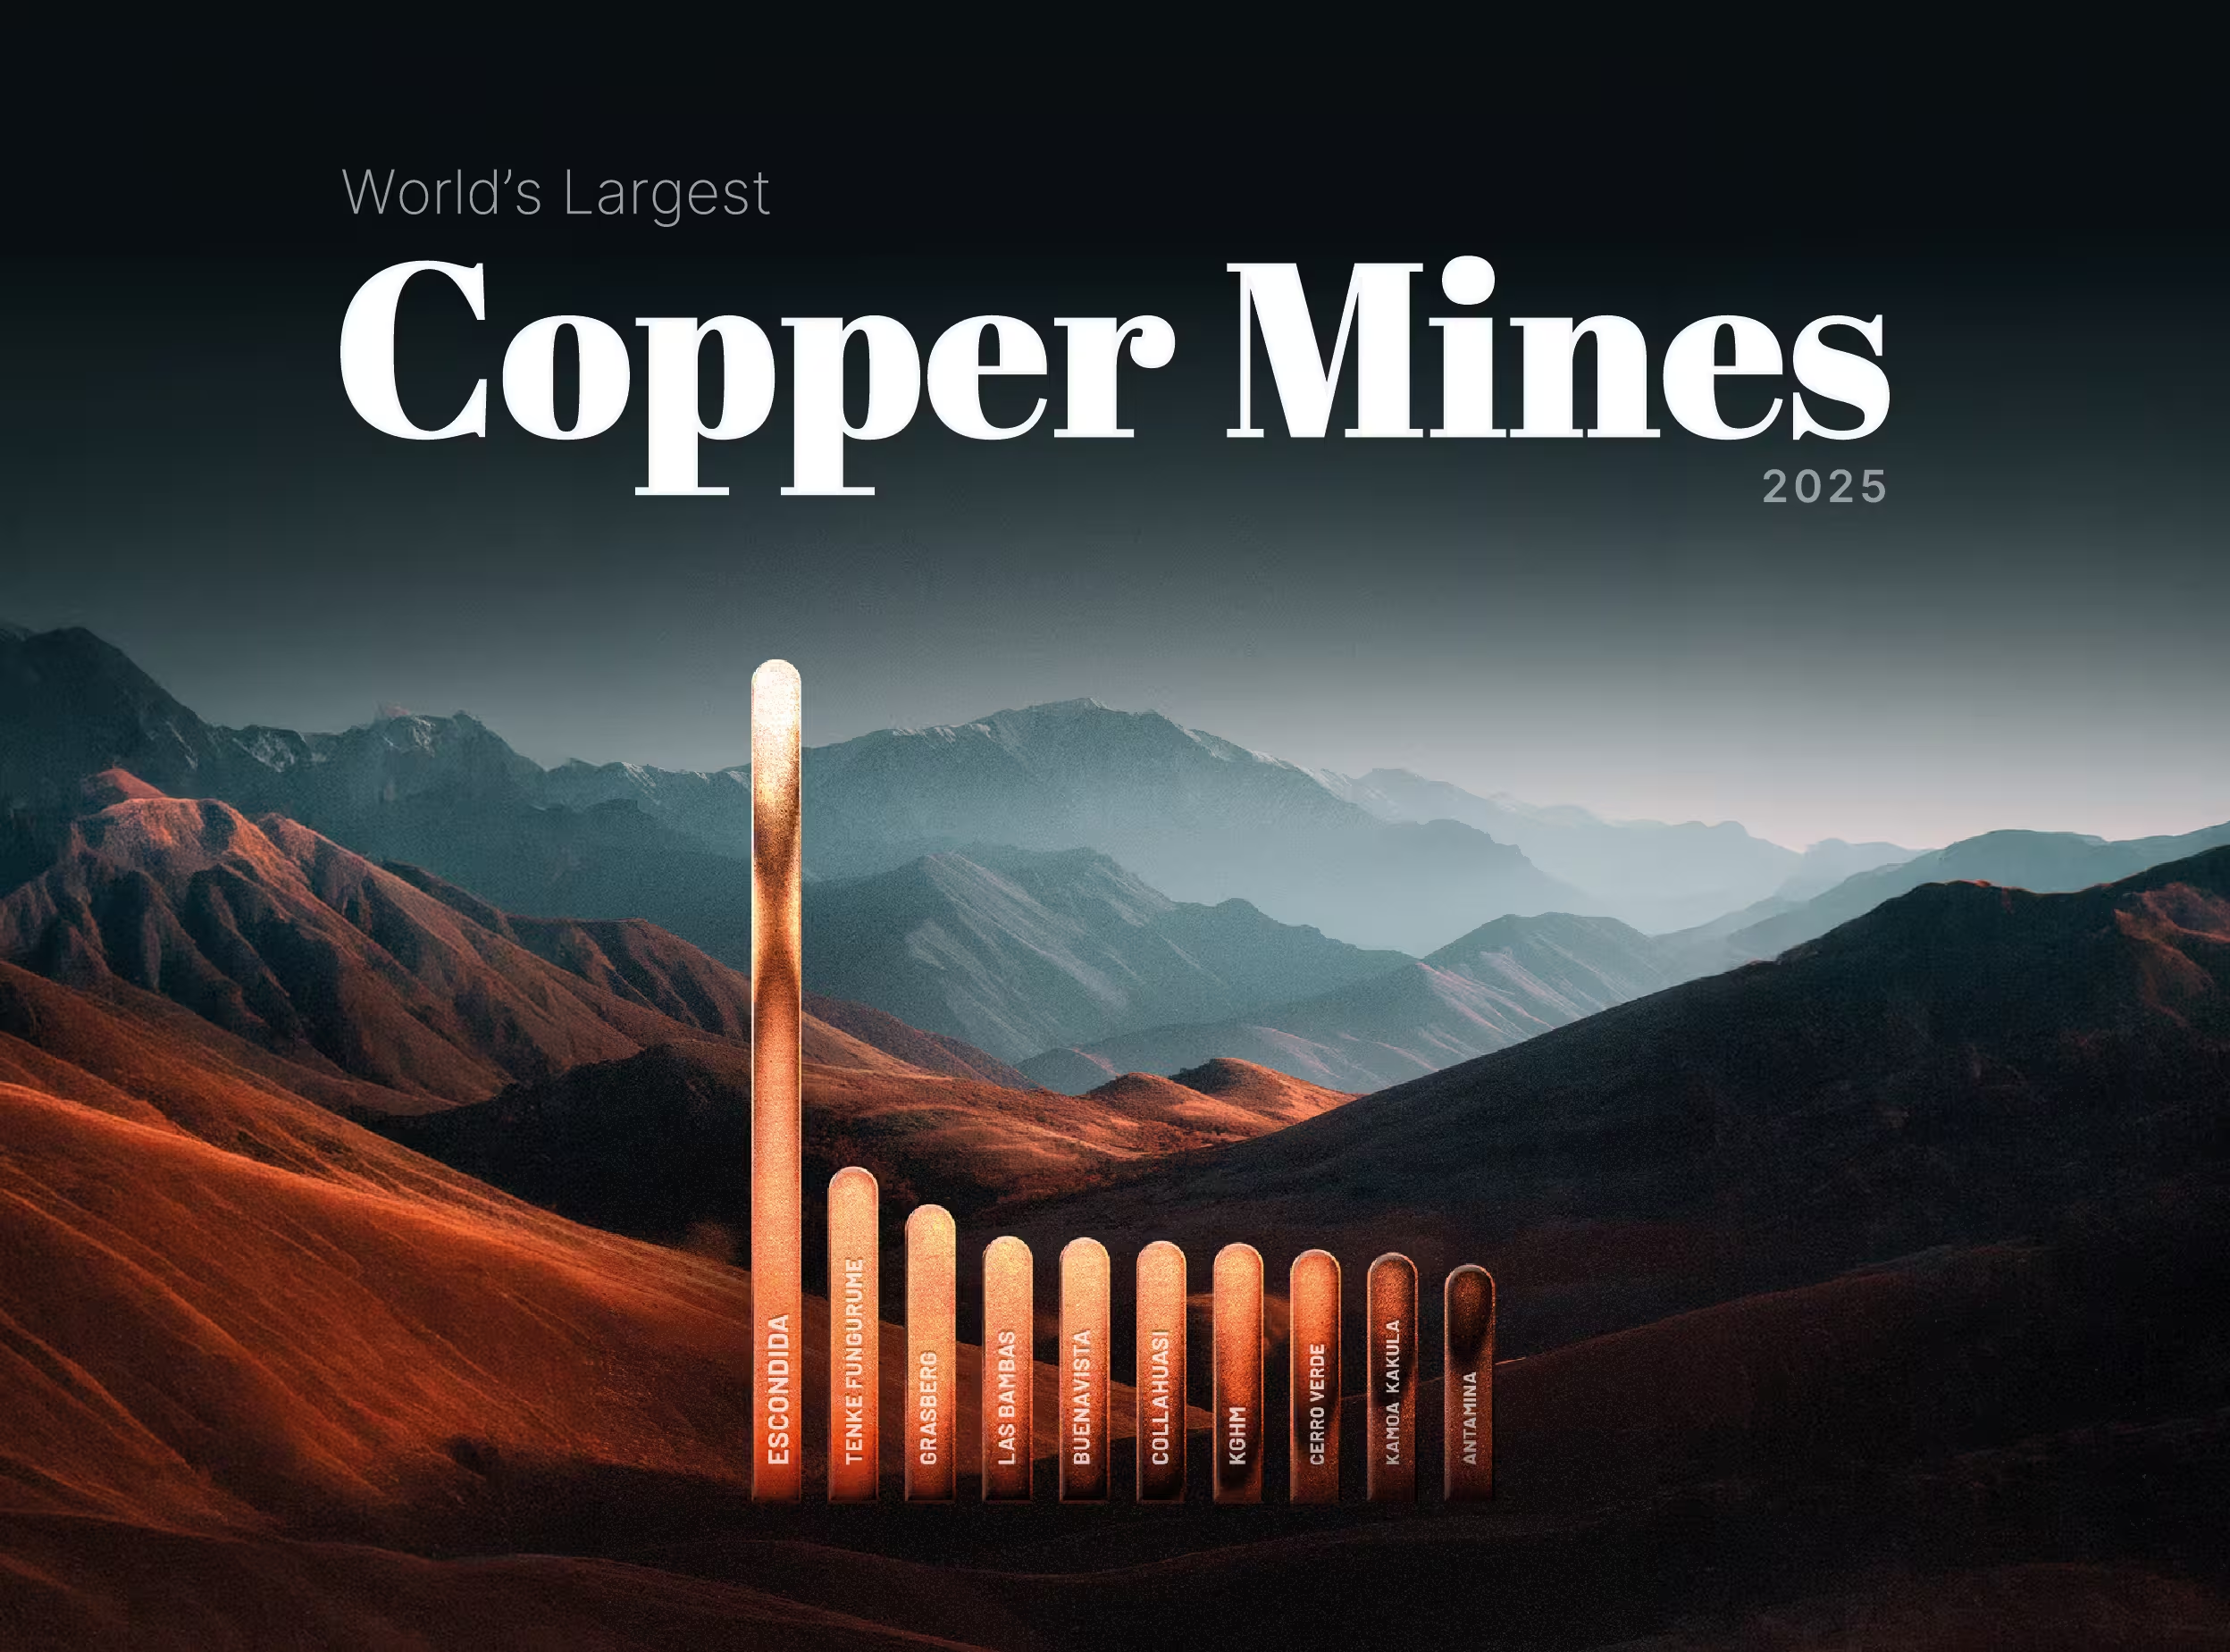
Copper has spent 2026 setting records, touching an intraday COMEX high of $6.71 per pound on May 13 amid AI-driven demand and supply shocks, against a backdrop where the ICSG now forecasts a 150,000-tonne deficit for 2026. In a market this tight, where the deficit thesis turns on lost tonnes, the question of where the world's copper actually comes from carries unusual weight.

Copper has spent most of 2026 doing something it had not done in a quarter century: setting fresh records every few weeks. The COMEX contract printed an intraday all-time high of $6.71 per pound on May 13, and the May monthly close looks set to land at the top of the historical chart. In London, copper traded above $14,000 per tonne in mid-May, touching $14,196.50, within reach of the LME's January 29 record of $14,527.50.

Copper futures touched an all-time high above $6.58 per pound on May 12, 2026, capping a 40.86% gain over the prior twelve months as supply tightness collided with structural demand from grid build-out, electric vehicles, and AI data centers. Earlier in the year, the LME benchmark rallied 22% to a record $13,387 per tonne on January 6, 2026. Behind the price action lies a less-discussed story: what it actually costs the world's largest miners to pull a pound of copper out of the ground.
As power-hungry AI data centers drive a projected 2-million-ton surge in global copper demand by 2030, market attention remains fixated on the supply side. Fourth-quarter 2025 metrics provide a definitive look at how the world's top miners closed out the year. While overall volumes remain heavily concentrated among a few historic industry giants, the true Q4 narratives emerged further down the list, as mid-tier producers leveraged flagship asset expansions to hit multi-year highs and offset the sector's ongoing struggle with declining ore grades.